Understanding Technical Analysis Charts
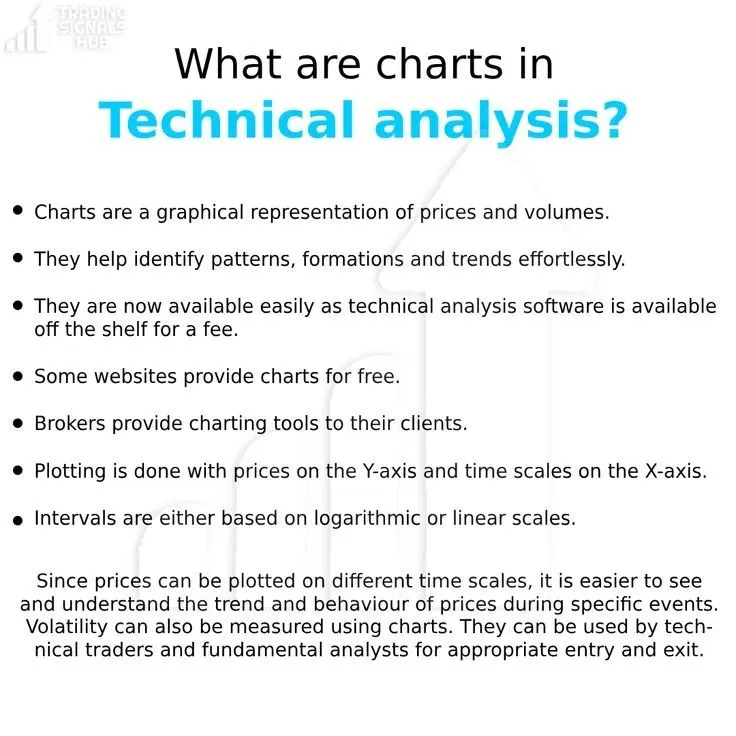
Charts in technical analysis are indispensable tools that provide a graphical representation of prices and volumes over time. They serve as the foundation for identifying patterns, formations, and trends, enabling traders and analysts to make informed decisions about market movements. The advent of sophisticated technical analysis software and the availability of free charting tools on various websites have made these charts accessible to anyone interested in market analysis.
The Essence of Technical Analysis Charts
At their core, technical analysis charts plot prices on the Y-axis against time on the X-axis. This visual representation allows for the easy identification of trends and patterns. By analyzing these charts, traders can discern market behavior, such as volatility and price movements during specific events, which are crucial for making strategic entry and exit decisions.
 |
| Technical Analysis Charts |
Types of Charts in Technical Analysis
There are several types of charts used in technical analysis, each offering unique insights into market behavior. The most commonly used charts include:
- Line Charts: Simple and easy to understand, line charts connect closing prices over a specific period with a continuous line.
- Bar Charts: These charts provide more detailed information by displaying the opening, closing, high, and low prices for each time interval.
- Candlestick Charts: Popular among traders, candlestick charts offer a visual representation of price movements with colored bodies indicating bullish or bearish trends.
Key Features of Technical Analysis Charts
Technical analysis charts are equipped with various features that enhance their utility:
- Indicators and Overlays: Tools like moving averages, Bollinger Bands, and RSI can be overlaid on charts to provide additional insights.
- Patterns and Formations: Recognizing chart patterns such as head and shoulders, double tops, and triangles can predict future price movements.
- Volume Analysis: Understanding volume trends helps in confirming price trends and detecting potential reversals.
Benefits of Using Technical Analysis Charts
The primary advantage of using technical analysis charts is their ability to simplify complex market data into an understandable format. This simplification enables traders to:
- Identify Trends: Charts help in recognizing long-term and short-term trends, which are essential for making informed trading decisions.
- Measure Volatility: By observing price fluctuations, traders can gauge market volatility and adjust their strategies accordingly.
- Predict Market Movements: Analyzing patterns and formations on charts can provide insights into potential future price movements.
The Role of Technology in Charting
With the advent of advanced technical analysis software, charting has become more sophisticated and user-friendly. Modern software offers a range of features, including customizable chart types, advanced indicators, and automated pattern recognition. Many brokers also provide charting tools to their clients, further enhancing accessibility.
Free vs. Paid Charting Tools
While there are numerous free charting tools available online, paid software often offers more advanced features and greater accuracy. Free tools are suitable for beginners and casual traders, whereas professional traders may benefit from the comprehensive analysis capabilities of paid software.
Conclusion
Technical analysis charts are a vital resource for traders and analysts, providing a clear and concise way to understand market behavior. By leveraging these charts, individuals can make more informed decisions, identify trends, and develop effective trading strategies. Whether using free tools or advanced software, the key to successful trading lies in the accurate interpretation of these charts.
FAQs
What are technical analysis charts?
Technical analysis charts are graphical representations of market prices and volumes over time, used to identify patterns, trends, and potential future movements.
How do technical analysis charts help traders?
These charts help traders by simplifying complex market data, making it easier to identify trends, measure volatility, and predict future price movements.
What are the common types of technical analysis charts?
The common types of charts include line charts, bar charts, and candlestick charts, each offering unique insights into market behavior.
Can I use free charting tools for technical analysis?
Yes, many free charting tools are available online, suitable for beginners and casual traders. However, advanced traders may prefer paid software for its additional features and accuracy.
What features do technical analysis charts offer?
Key features include indicators and overlays, pattern recognition, and volume analysis, all of which enhance the utility of the charts for market analysis.
How does technology impact technical analysis charting?
Advanced technical analysis software provides more sophisticated features, customizable charts, and automated pattern recognition, making charting more accessible and efficient.
Suggestions for Inbound and Outbound Links
Inbound Links:
- "Understanding Market Trends" article for deeper insights into trend analysis.
- "Introduction to Technical Indicators" for a comprehensive guide on using indicators with charts.
- "Advanced Trading Strategies" for strategies that utilize technical analysis charts.
Outbound Links:
- Investopedia's guide on Technical Analysis for foundational knowledge.
- TradingView for access to advanced charting tools.
- MarketWatch for real-time market data and charts.